2 min to read
Upgrade to Grafana 7
and everything that will go wrong
Grafana 7 is out and you want to upgrade. Reading through the Changelog it seems nothing could go wrong but it will.
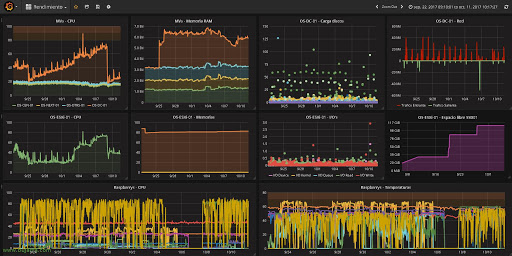
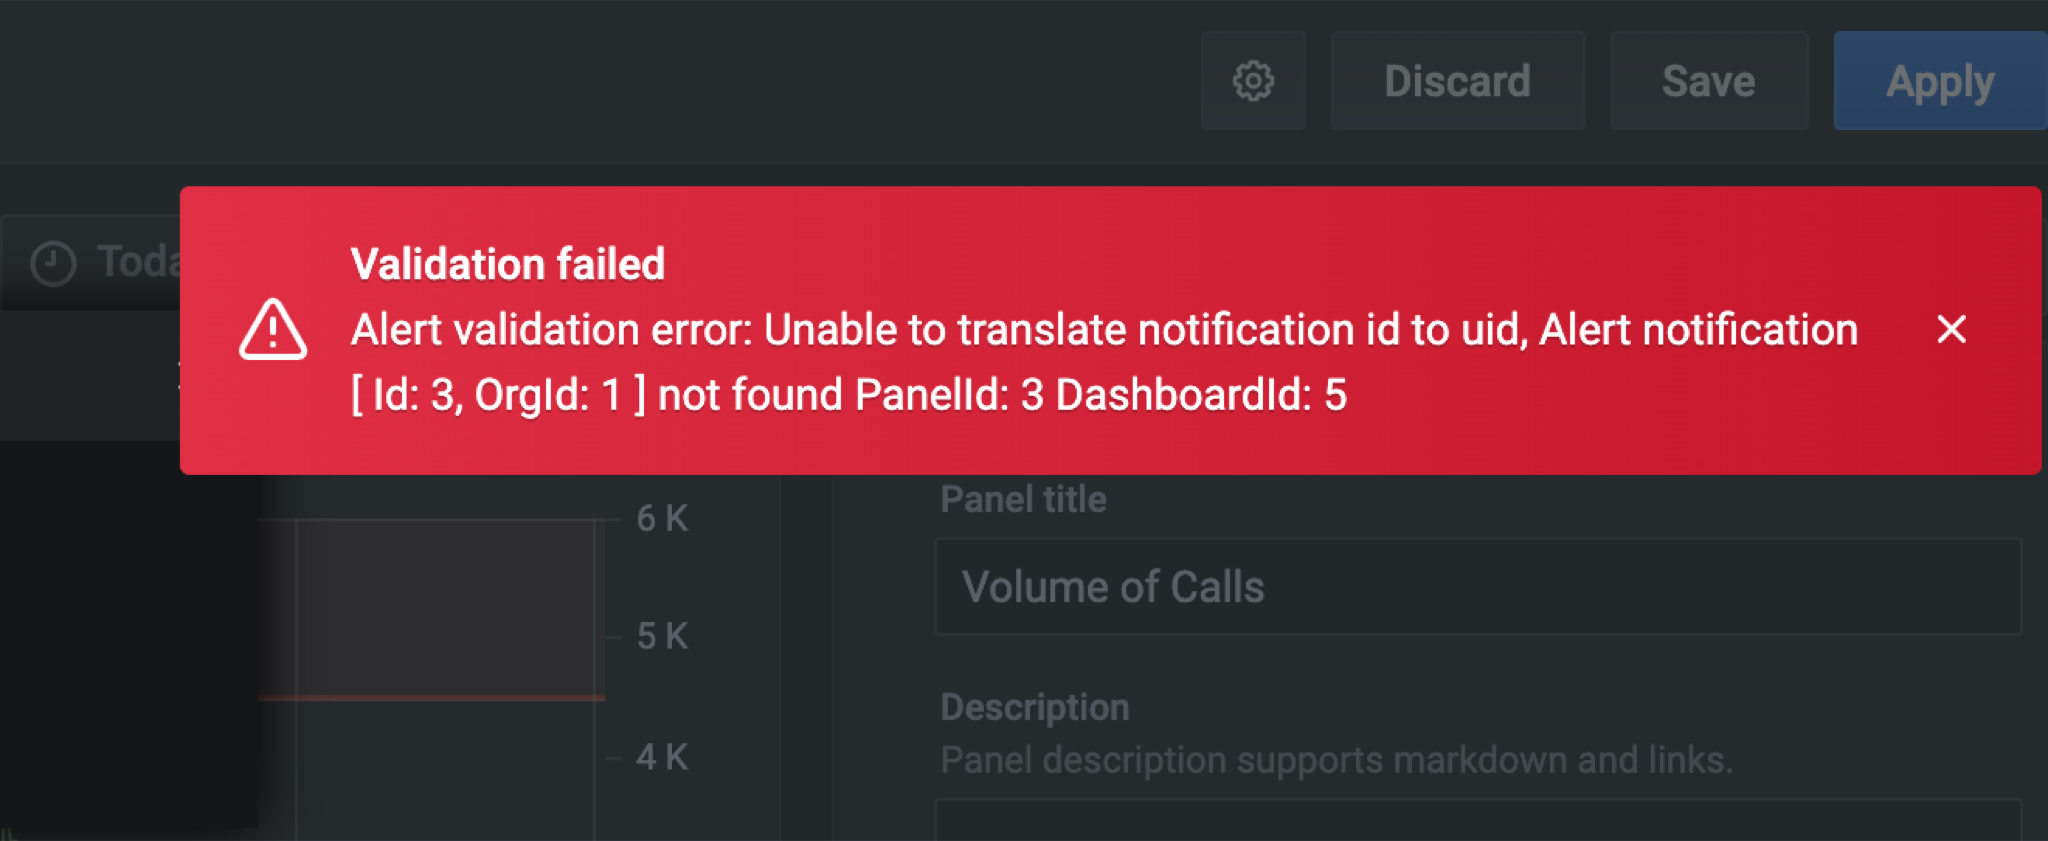
First of all when you go to your alerts page you will get an error when you try to Test it
You will have to edit the JSON of your model:
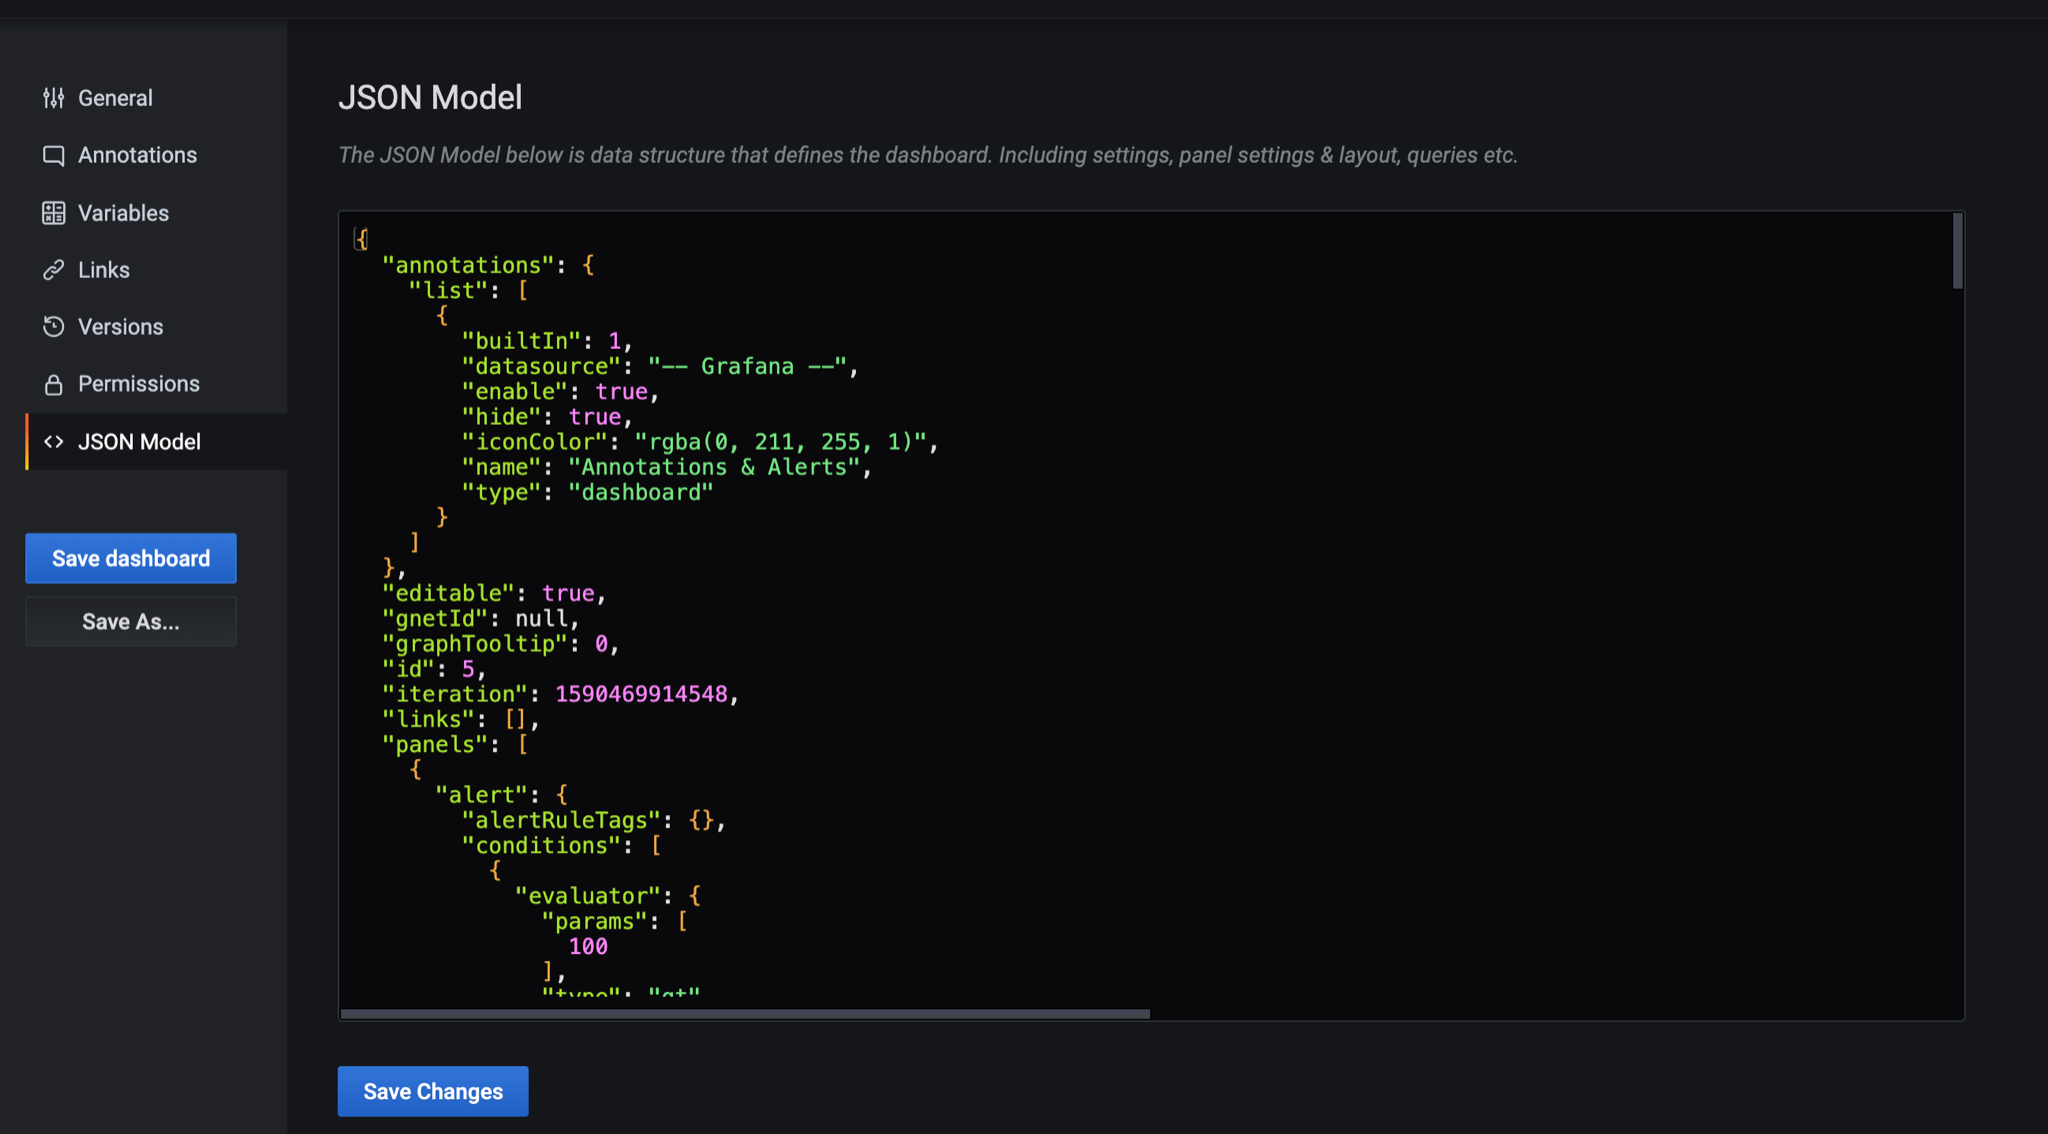
Looking for the notifications sections like so
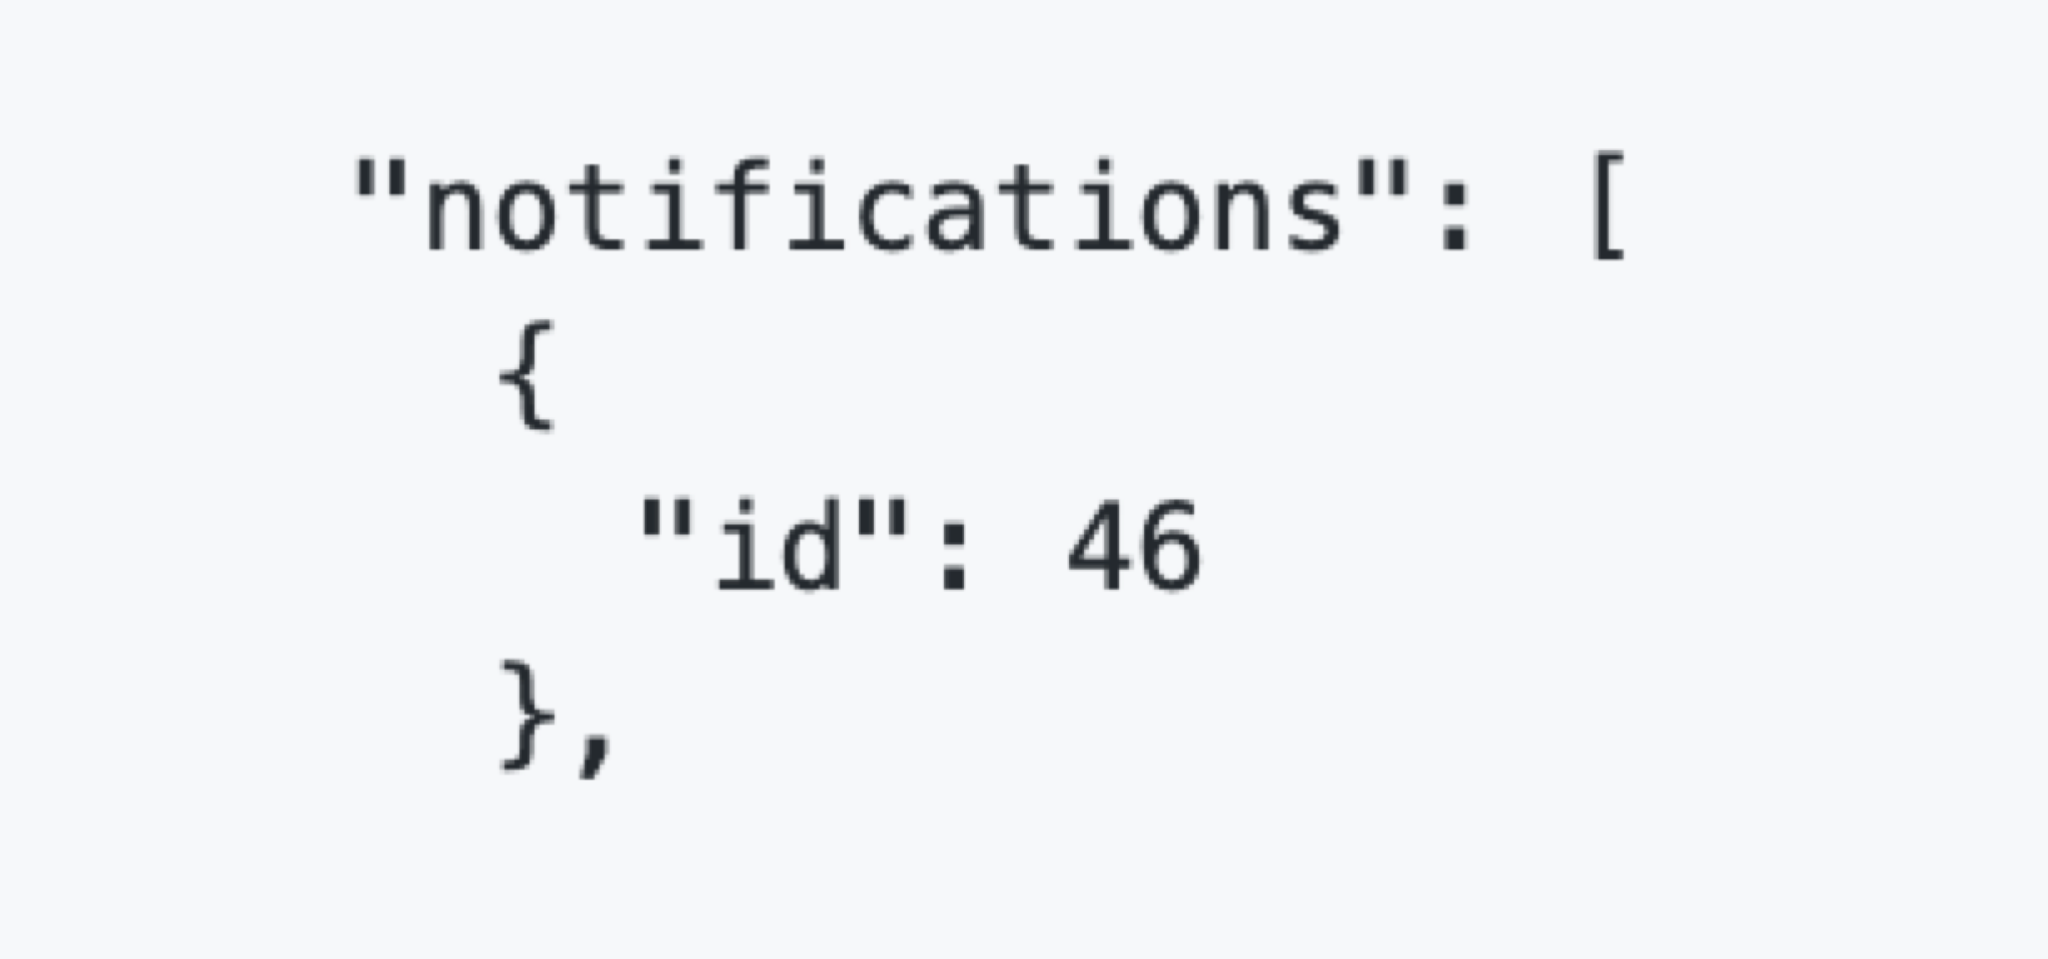
and removing the { ‘id’: XX } parts. Only then will you be able to save and test your model.
If you are using variables inside your query you will see no data
For example something like this:
AND ("account_id" =~ /^$account_id$/) AND ("hostname" =~ /^$hostname$/) AND ("endpoint" =~/^$endpoint$/)
won’t work in alert queries.
PhantomJS has been removed which means you won’t be able to render images in your alert emails.
Instead you will see something like this
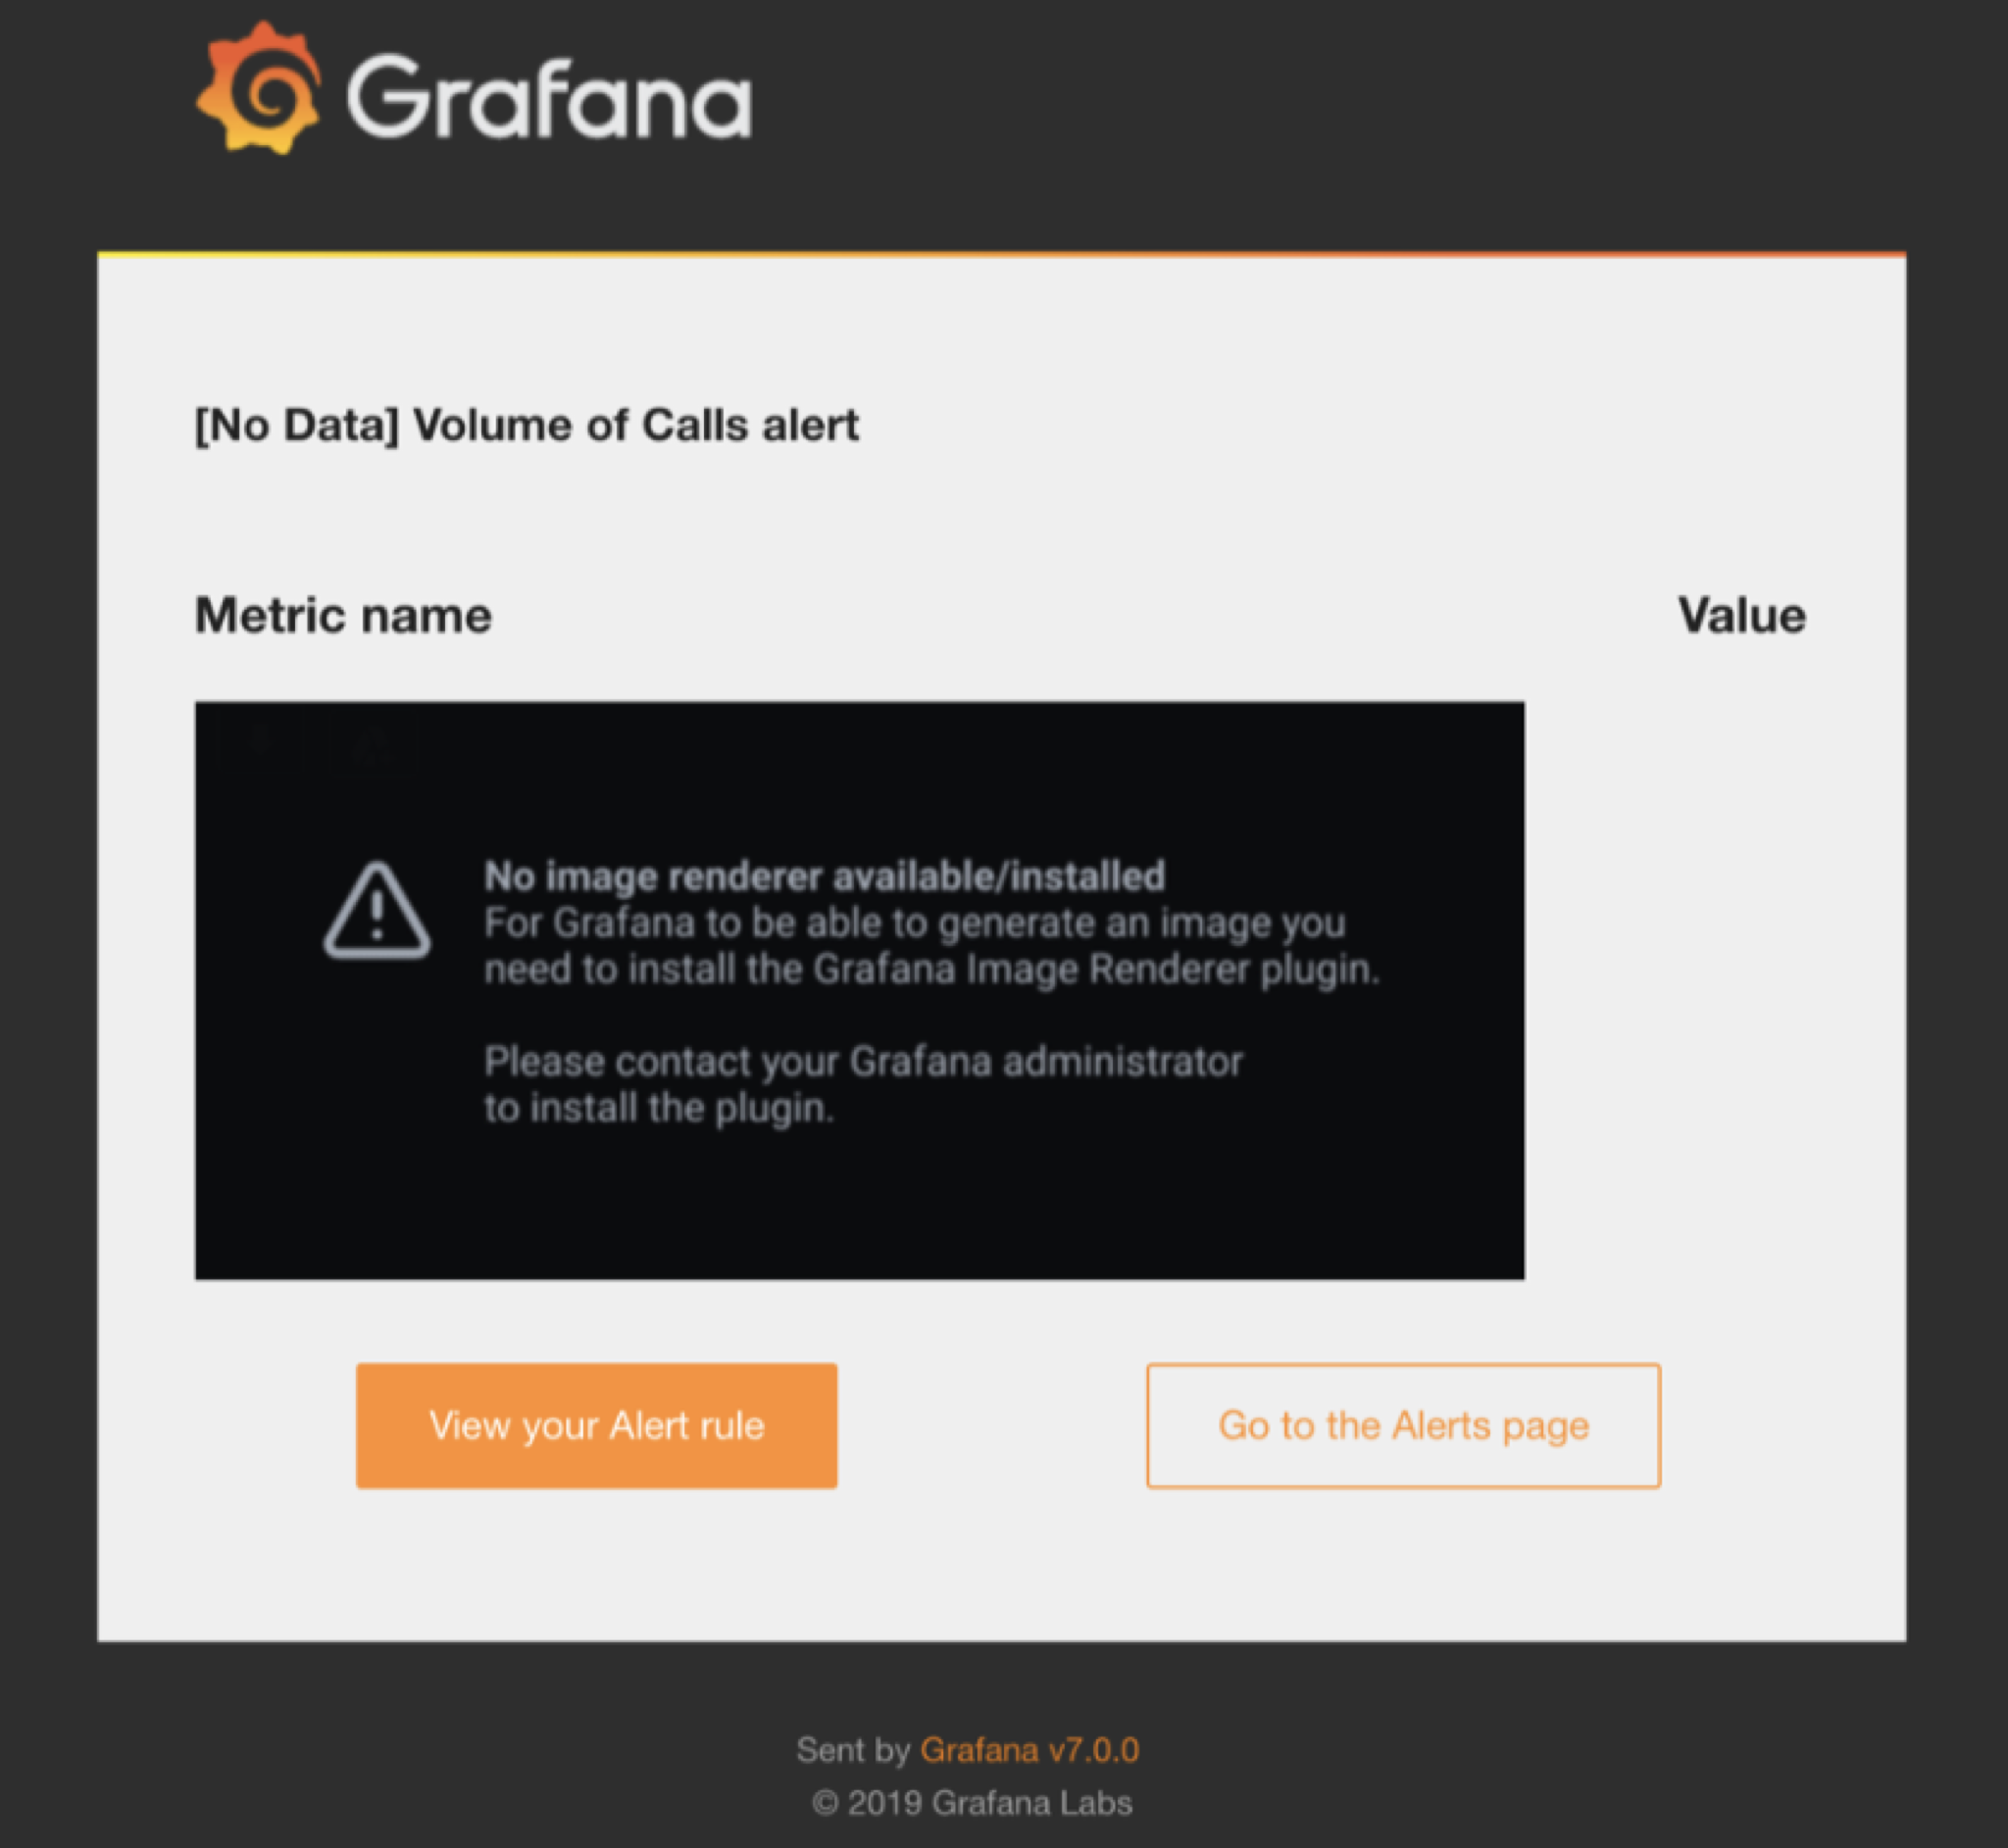
But it’s cool you anticipated that because the docs said you’re gonna have to install the rendering plugin
grafana-cli plugins install grafana-image-renderer
Still no dice though. Only later will you realize Ubuntu requires some additional packages to make this work.
apt install libx11-6 libx11-xcb1 libxcomposite1 libxcursor1 libxdamage1 libxext6 libxfixes3 libxi6 libxrender1 libxtst6 libglib2.0-0 libnss3 libcups2 libdbus-1-3 libxss1 libxrandr2 libgtk-3-0 libgtk-3-0 libasound2
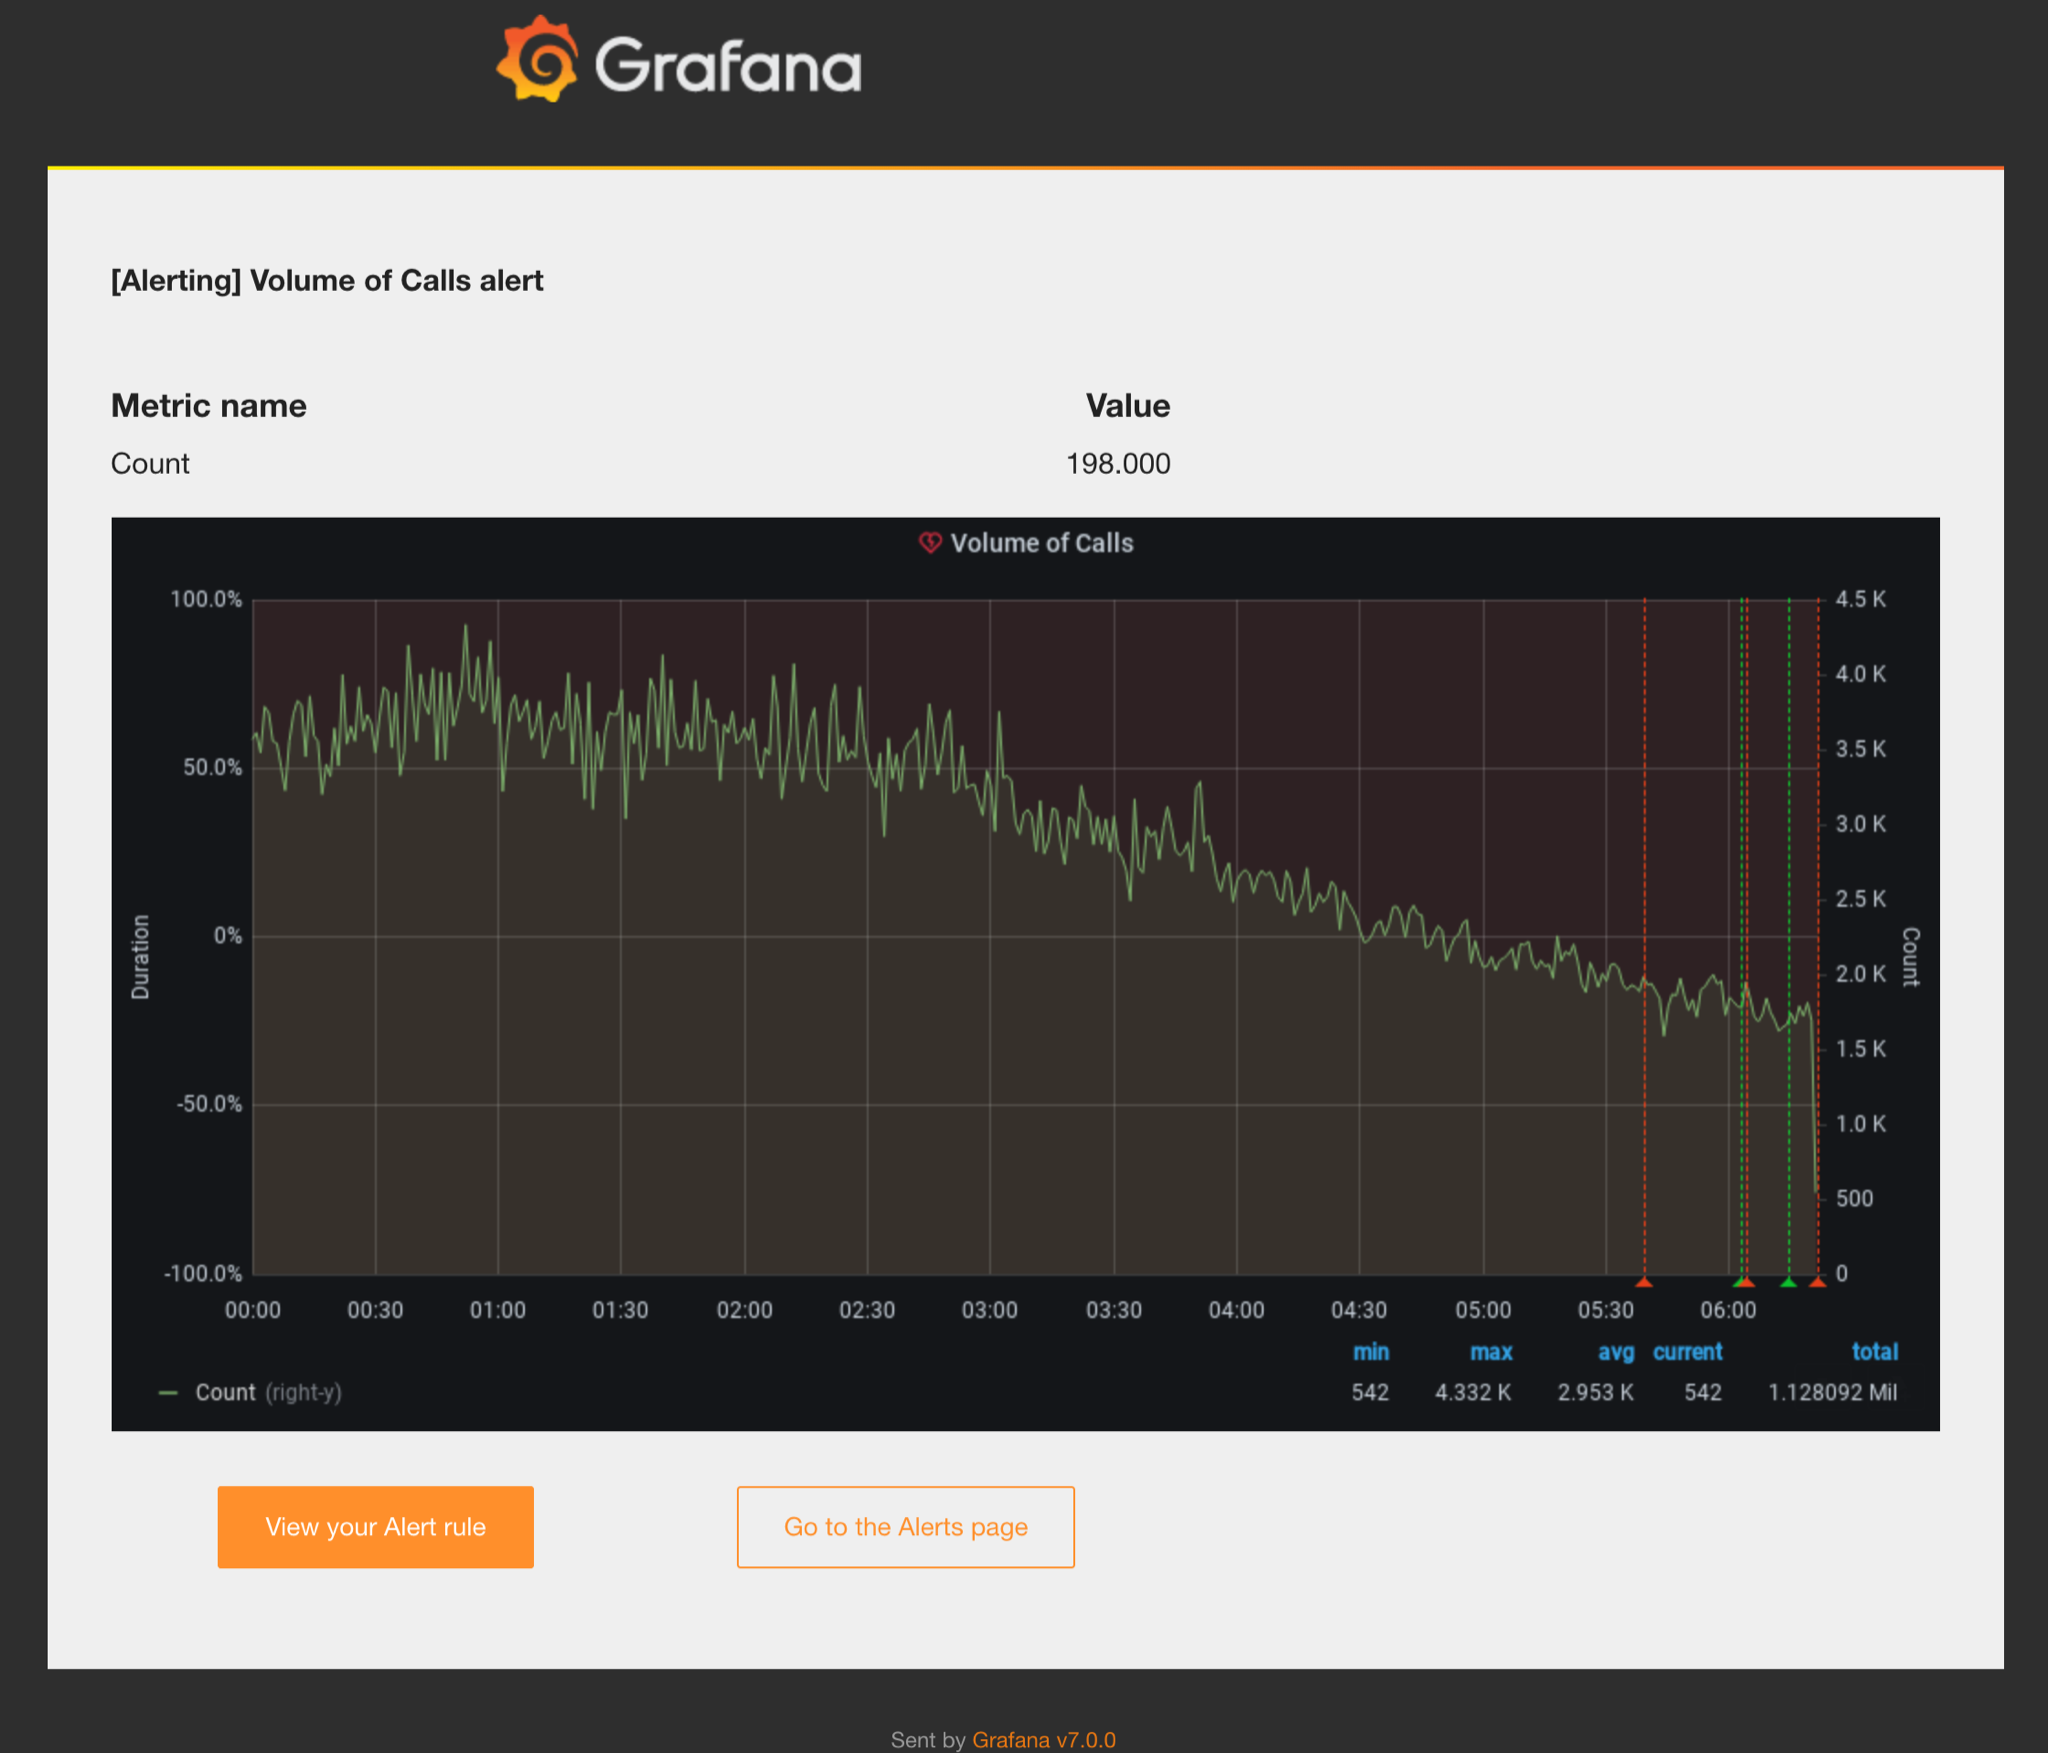
and you’re back in business
BONUS
Just when you think you can call it a night you get a Timeout error on certain alerts. It’s taking too long to render the PNG file to attach to the email.
More specifically
t=2020-05-27T01:44:16+0000 lvl=info msg=Rendering logger=rendering renderer=plugin path="d-solo/I1Ei4r3mz/monitoring-postgresql-server-postgres-replication?orgId=1&panelId=32"
t=2020-05-27T01:44:16+0000 lvl=dbug msg="Calling renderer plugin" logger=rendering renderer=plugin req="url:\"http://127.0.0.1:8080/d-solo/I1Ei4r3mz/monitoring-postgresql-server-postgres-replication?orgId=1&panelId=32&render=1\" width:1000 height:500 deviceScaleFactor:1 filePath:\"/var/lib/grafana/png/kMhziqV30i2XZDVROePr.png\" renderKey:\"Iu1FMei1f6NcDXEMBmi1CH64vnGn0ApY\" domain:\"127.0.0.1\" timeout:15 "
t=2020-05-27T01:44:31+0000 lvl=info msg="Rendering timed out" logger=rendering renderer=plugin
t=2020-05-27T01:44:31+0000 lvl=eror msg="Failed to render and upload alert panel image." logger=alerting.notifier ruleId=10 error="Timeout error. You can set timeout in seconds with &timeout url parameter"
But when you try to generate the PNG file manually by ‘Sharing’ the alert you can do it without a timeout so it must be just alerting that’s timing out.
You go through your /etc/grafana/grafana.ini and find
timeout = 30
but changing it to
timeout = 60
does nothing.
So finally you read the docs and realize there’s an additional setting for alerting timeouts. Go to the [alerting] section and add
notification_timeout_seconds = 60
The default is 30 so if your PNG takes longer than that to generate the alert will timeout.